


April at a glance
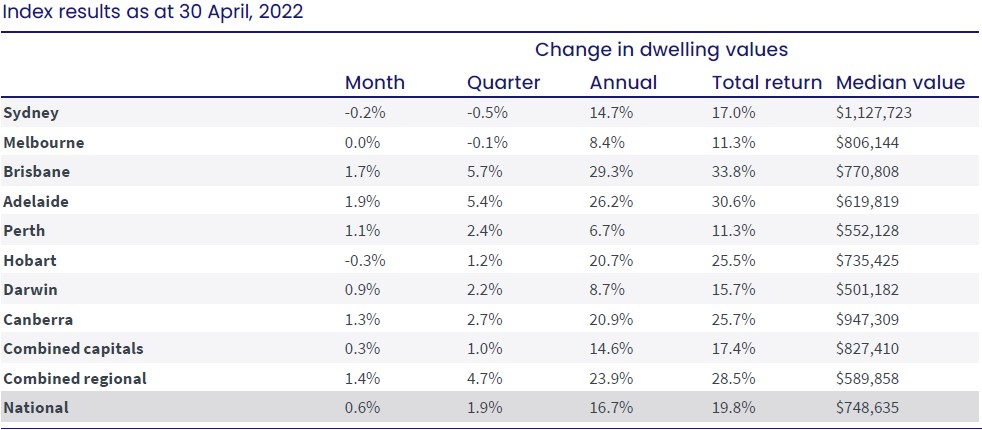
- National dwelling values increased by 0.6% in the month of April, and 1.9% for the last quarter,
- Slight declines in value were evident in Hobart (-0.3%) and Sydney (-0.2%),
- Adelaide and Brisbane had the strongest results with their housing values rising by 1.9% and 1.7% respectively,
- Total advertised properties is close to 30% below the previous five-year average,
- Most capital cities have seen positive rental growth in the year so far,
- Regional markets continue to record steady rises as demand remains high.
Housing values
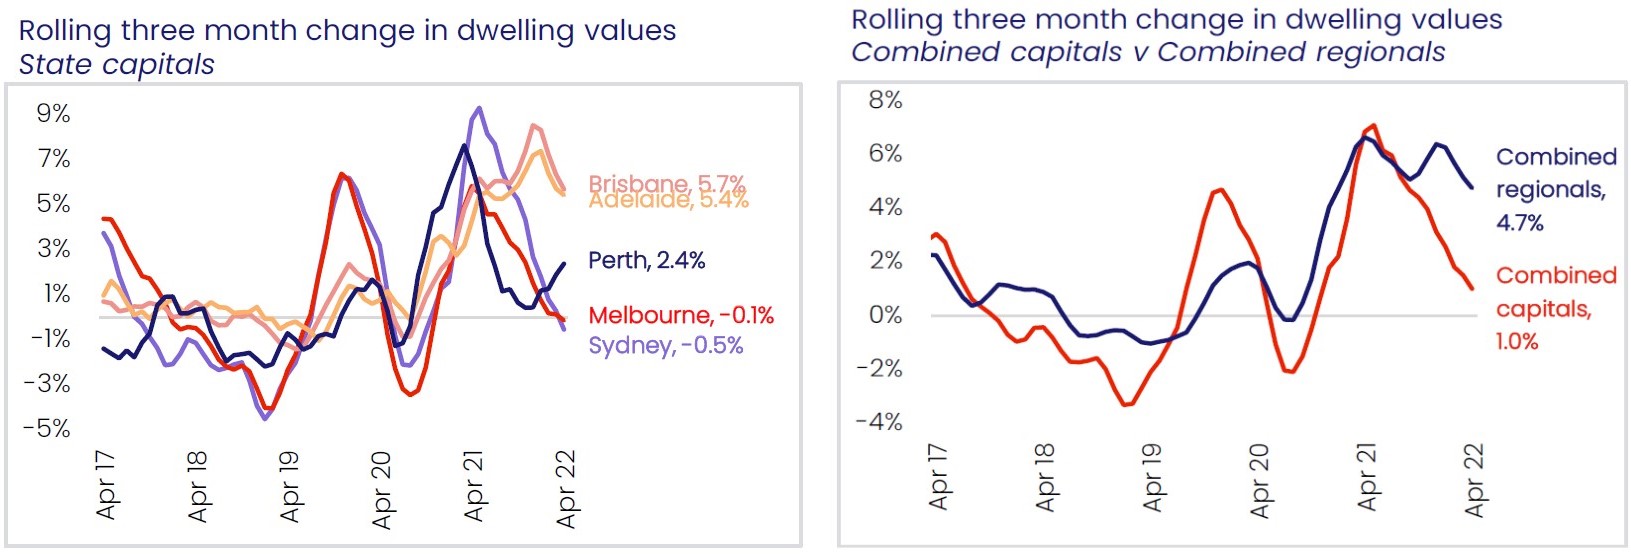
National house prices rose by 0.6% driven by the regional markets as well as Adelaide and Brisbane. Hobart and Sydney saw values reduce over the month while Melbourne prices plateaued.
 Source: CoreLogic Hedonic Home Value Index, 2 May 2022.
Regional areas again performed better than the capital cities with price growth of 4.7% over the last quarter compared to 1.0%. Regional Australia looks to be somewhat insulated from slowdown in property demand and growth. This had led to the median property value rising to $589,858 in the combined regional areas, an annual growth of 23.9%. Despite the rapid rise, properties remain more affordable than those in the capital cities where median values are $1,127,723 in Sydney, $806,144 in Melbourne, $770,808 in Brisbane, and $619,819 in Adelaide.
Source: CoreLogic Hedonic Home Value Index, 2 May 2022.
Stock levels remain low
Nationally there were 39,704 new property listings in the 4 weeks to 24 April 2022 which is 3.8% lower than the same time last year. In the same period we see total listings of 141,063 which is 11.3% down on last year. The data broken down by state tells us some key differences in the total supply of properties available to potential buyers.
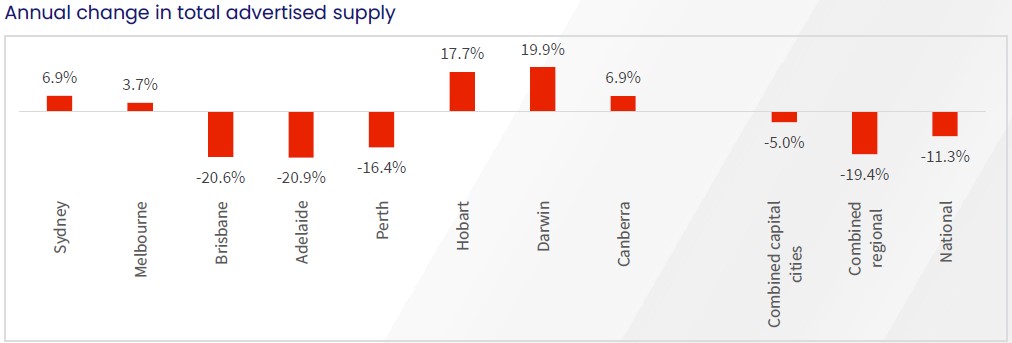
The chart below shows the weaker markets such as Sydney, Melbourne, and Hobart having a greater annual change in new properties listed for sale. Buyer demand has dropped and so properties are taking longer to sell, are on the market for longer, and often have greater vendor discounting.
Brisbane and Adelaide have 20.6% and 20.9% less properties advertised for sale than they did a year ago. This lack of supply means buyers are still competing for available properties and underpinning the house prices in these capital cities performing better than others over the course of April.
Source: CoreLogic Hedonic Home Value Index, 2 May 2022.
Rental market
Many of the capital cities have experienced positive rental growth in 2022. Nationally, rents increased by 2.7% over the last quarter, and 9.0% over the last year.
Rents in units also look to be rising faster than those for houses, particularly across Sydney and Melbourne where rents were significantly impacted during the period of COVID restrictions.
Tim Lawless, research director at CoreLogic said “The shift in rental demand towards units reflects both rental affordability pressures, which are deflecting more demand towards the ‘cheaper’ unit sector, and the return of overseas migrants and visitors. Rental demand from overseas arrivals tends to skew towards inner city and higher density precincts.”
Outlook
The increase in the cash rate target of 0.25% by the Reserve Bank in early May will likely have an impact in the demand from home buyers and investors, especially with expectations of more to come. We are likely to see a normalisation in real estate related activity going forward as opposed to the rapid rise in prices and fast movement of advertised stock.
House price growth will continue to soften as affordability also becomes a factor. With unemployment rates being low, home owners will be in a position to meet the higher repayments from the rising interest rates. Government incentives for first home buyers and increased migration levels may also assist in maintaining a level of buyer demand which could help home owners keep the bulk of the capital gains in the past few years.
CLICK HERE TO DOWNLOAD THE FULL REPORT
Author: Frank Knez

Disclaimer: The opinions posted within this blog are those of the writer and do not necessarily reflect the views of Better Homes and Gardens® Real Estate, others employed by Better Homes and Gardens® Real Estate or the organisations with which the network is affiliated. The author takes full responsibility for his opinions and does not hold Better Homes and Gardens® Real Estate or any third party responsible for anything in the posted content. The author freely admits that his views may not be the same as those of his colleagues, or third parties associated with the Better Homes and Gardens® Real Estate network.